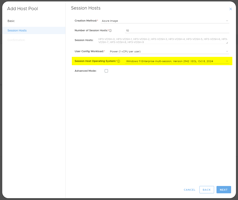
After a Golden Image is created, deploy a new Session Host with it Create Session Hosts from the...
Overview of the Reports Autoscale Monitoring Dashboard
As a client you can see all your deployments at a glance and their basic status in a number of key areas, primarily autoscale. Likewise as a reseller you can see all your customers deployments.
To use this feature log into the MyCloudIT (MCIT) portal and navigate to "Reports" then "Autoscale Monitoring".
If any of the statuses are not as expected we welcome you to reach out to MCIT support.
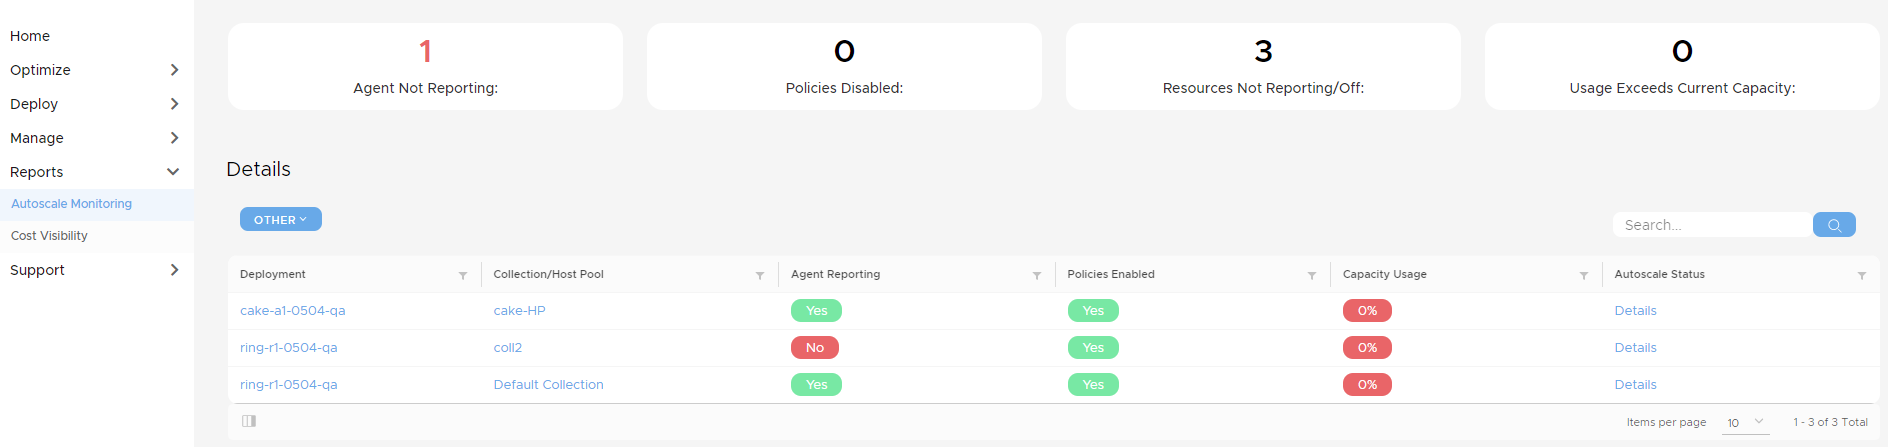
The following is an overview of what each section relates to.
Agent Reporting
RDS
This status can be either Yes or No. "Yes" means that the MCIT RDS agent installed on one of the virtual machines (usually the domain controller called MSDC-001) is sending back updates to the MCIT portal. "No" here may indicate that the MCIT agent VM is deallocated or the agent requires restarting.
AVD
This status can be either Yes or No. "Yes" means that the MCIT portal can get AVD details from the Azure portal. "No" here may indicate the provider access between Azure and the MCIT portal having communication issues.
Policies Enabled
RDS
This status can be either Yes or No. "No" means that autoscale for the collection has been disabled by an MCIT portal user. To enable simply navigate to "Manage" then "Autoscale". Select the deployment then the collection. Click "Enable Autoscale", type a comment then click Enable.
AVD
This status can be either Yes or No. "No" means that autoscale for the host pool has been disabled by an MCIT portal user. To enable simply navigate to "Manage" then "Autoscale". Select the deployment then the host pool. Click "Enable Autoscale", type a comment then click Enable.
Autoscale Status
Use the details link to see various extra information:
Last Reported : Shows the date the MCIT RDS agent or Azure reported information regarding this collection/host pool (see Agent Reporting).
Current Active Users : Shows the current active logged in users is this collection/host pool.
Current Available Capacity : Shows the total amount of users that could log in comfortably to this collection/host pool give the running session hosts.
Session Hosts Running : Current number of running session hosts in this collection/host pool. Does not include session hosts in manual/maintenance mode. Some of these session hosts may be in drain mode.
Session Hosts Deallocated: Session hosts that are deallocated but available to scale-out this collection/host pool.
Session Hosts in Manual/Maintenance Mode : The number of session hosts that are not available to autoscale because they are in manual or maintenance mode.
Total Number of Session Hosts : The total number of session hosts in this collection/host pool.
Overview Panel:
Last Refresh: Shows the time this page last refreshed.
Agent Not Reporting: Shows the number of host pools / collections with agents not reporting (see above detailed description).
Policies Disabled: Shows the number of host pools / collections with policies disabled (see above detailed description).
Collections / Host Pools with 0% Usage: Shows the number of host pools / collections that are at 0% capacity (see above detailed description). This usually just means no users are currently logged in.
Usage Exceeds Current Capacity: Shows the number of host pools / collections that are over 100% capacity (see above detailed description).